
A scenario, told by a marketing lead in a twelve person team. The steps are the app’s own, as the app and the BearingBridge help center show them on October 29, 2026.
The job, and why it hurt
At a Monday meeting our director asked a fair question: which Google searches bring people to our site, and is it getting better or worse?
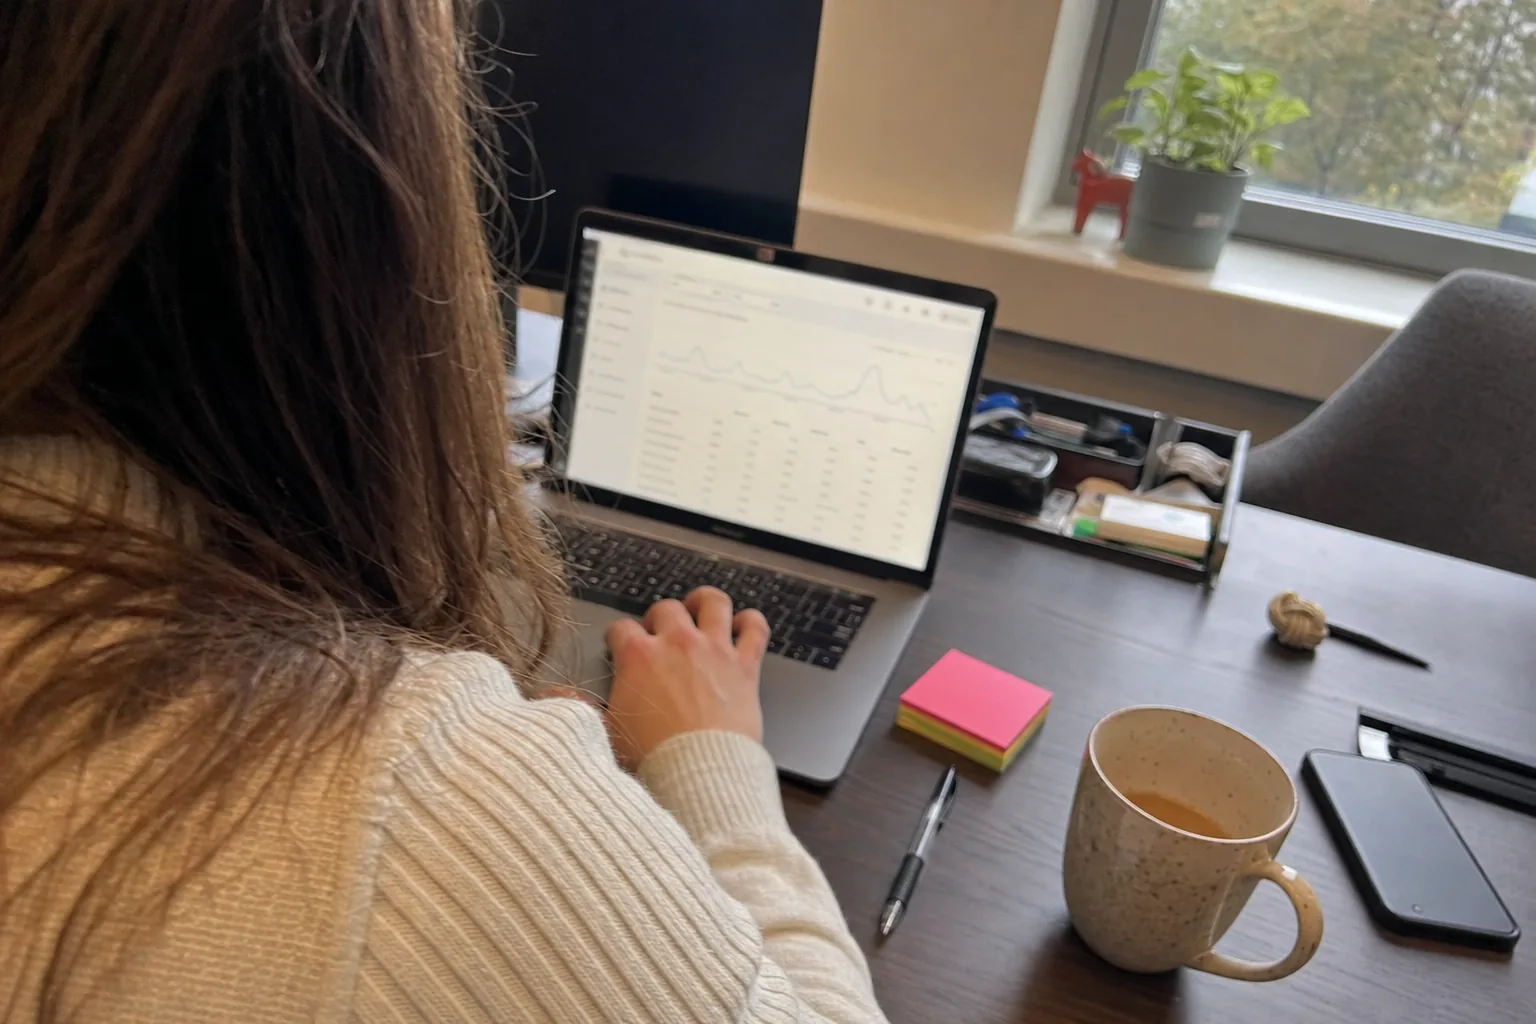
I didn’t know. The answer lived in Google Search Console, and only our freelance web developer ever logged in there. Every time we wanted a number, someone sent them a message and waited for a screenshot.
I wanted to read those figures myself, in the app where we already plan our content, without learning a new tool.
What I did in BearingBridge
Connect my own Search Console
On My Connections, in the Your website figures card, I signed in with the Google account that already had access to our site’s property. The connection only reads: nothing is ever changed or submitted in Search Console. The figures are mine: connecting them gave nobody else in the company access.
Then I opened Search in the left menu, went to SEO and clicked the Console tab.
Pick the site and the period
The band at the top names the website being read. The Property list offers the Search Console properties that cover it, with the domain property first.
The Period list runs from the last 7 days to the last 12 months, and 28 days is the default. Search Console runs about three days behind, so every period ends three days ago. The exact dates sit next to the list, which saved me from comparing the wrong weeks.
Read the searches behind the clicks
Insights opens on clicks and impressions, each with a small curve and its change against the period before. Under them, Queries leading to your site lists the searches people typed before they clicked, and Your content lists the pages they landed on. Both cards have Top, Trending up and Trending down tabs.
Top countries adds where the clicks come from, with each country’s share.
Performance goes into detail:
| Part | What it shows |
|---|---|
| Four tiles | Clicks, impressions, average CTR and average position, each against the period before |
| Day by day | Clicks and impressions on one chart |
| Table | Every search, page, country and device, sortable by any column, with a filter box |
Check which pages Google actually indexed
A page Google hasn’t indexed can’t bring anyone in. On Indexing I clicked Check indexing now. The check reads our sitemaps and asks Google about up to 500 pages, one by one. It takes a few minutes, so I left the page and followed it in the Activity widget of the header.
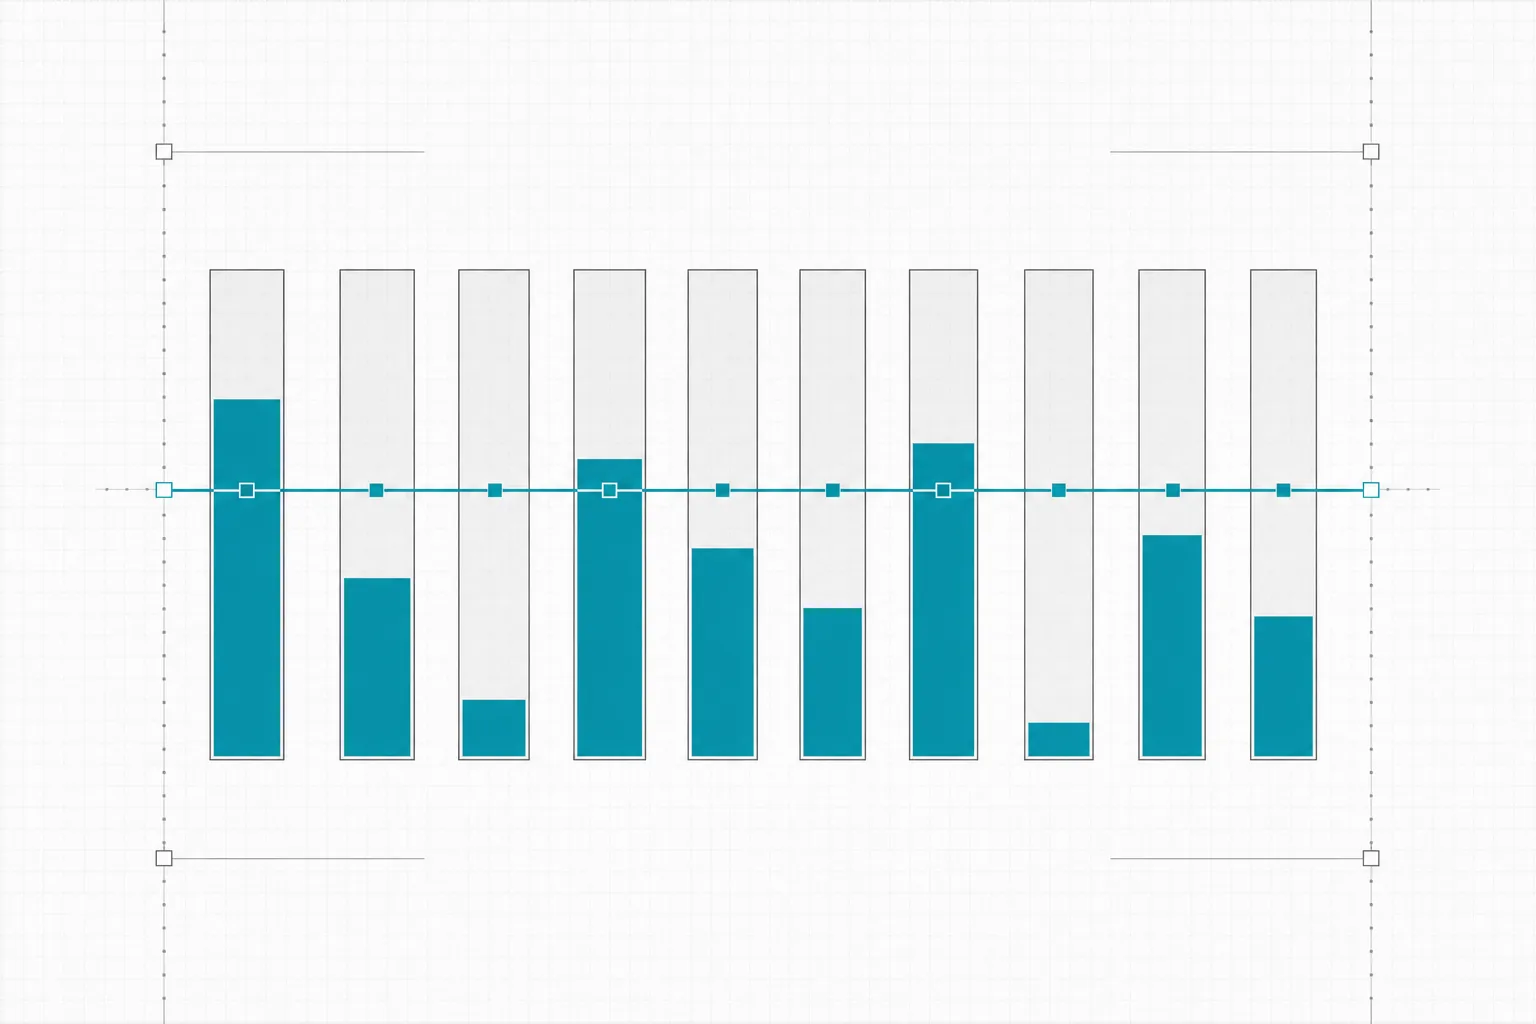
When it finished, Indexed and Not indexed counted the pages, and Why pages aren’t indexed listed Google’s own reasons. A click on a reason lists its pages, and Inspect opens one in Search Console’s URL inspection. Every check is kept, so a bar chart shows the trend from the first one on.
Sitemaps lists what Google knows of ours, with each one’s status and the pages it found.
The result
At the next Monday meeting I opened Console on the shared screen, switched Queries leading to your site to Trending up and read out the searches that were gaining clicks. This time, nobody waited for a screenshot.
The first indexing check listed a few pages Google knew about but hadn’t indexed, each with its reason. We now run a check after every batch of new pages. None of it costs anything from the wallet, the check included.
One limit to plan around: each check starts again from the top of the sitemaps, so on a site with more than 500 addresses it covers the same first 500 each time.
The video below walks through the same routine in the app.