

Modules / Business Intelligence
The dashboards you have, and the ones you describe.
Standard dashboards read the data the platform collects, and recompute it each time you open one. Describe another in plain words and it is built from the same data, kept in your menu, redrawn when you open it. A weekly operating review explains what moved and why. A monthly report goes to the board.
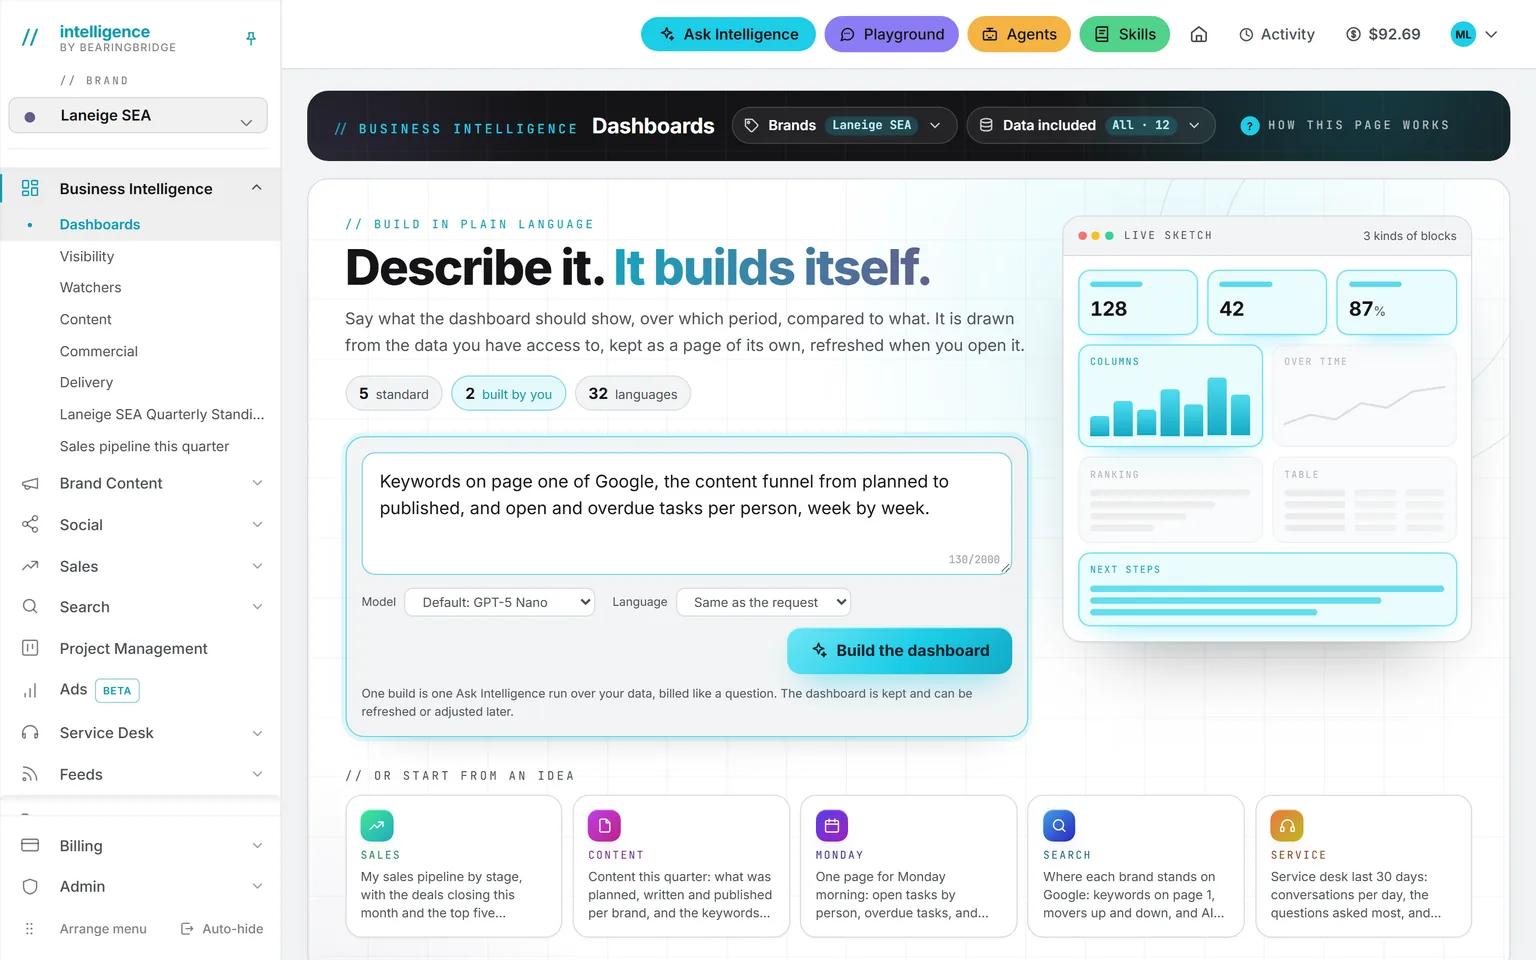
Demo workspace. Invented brand and figures.
Four pages that are already there.
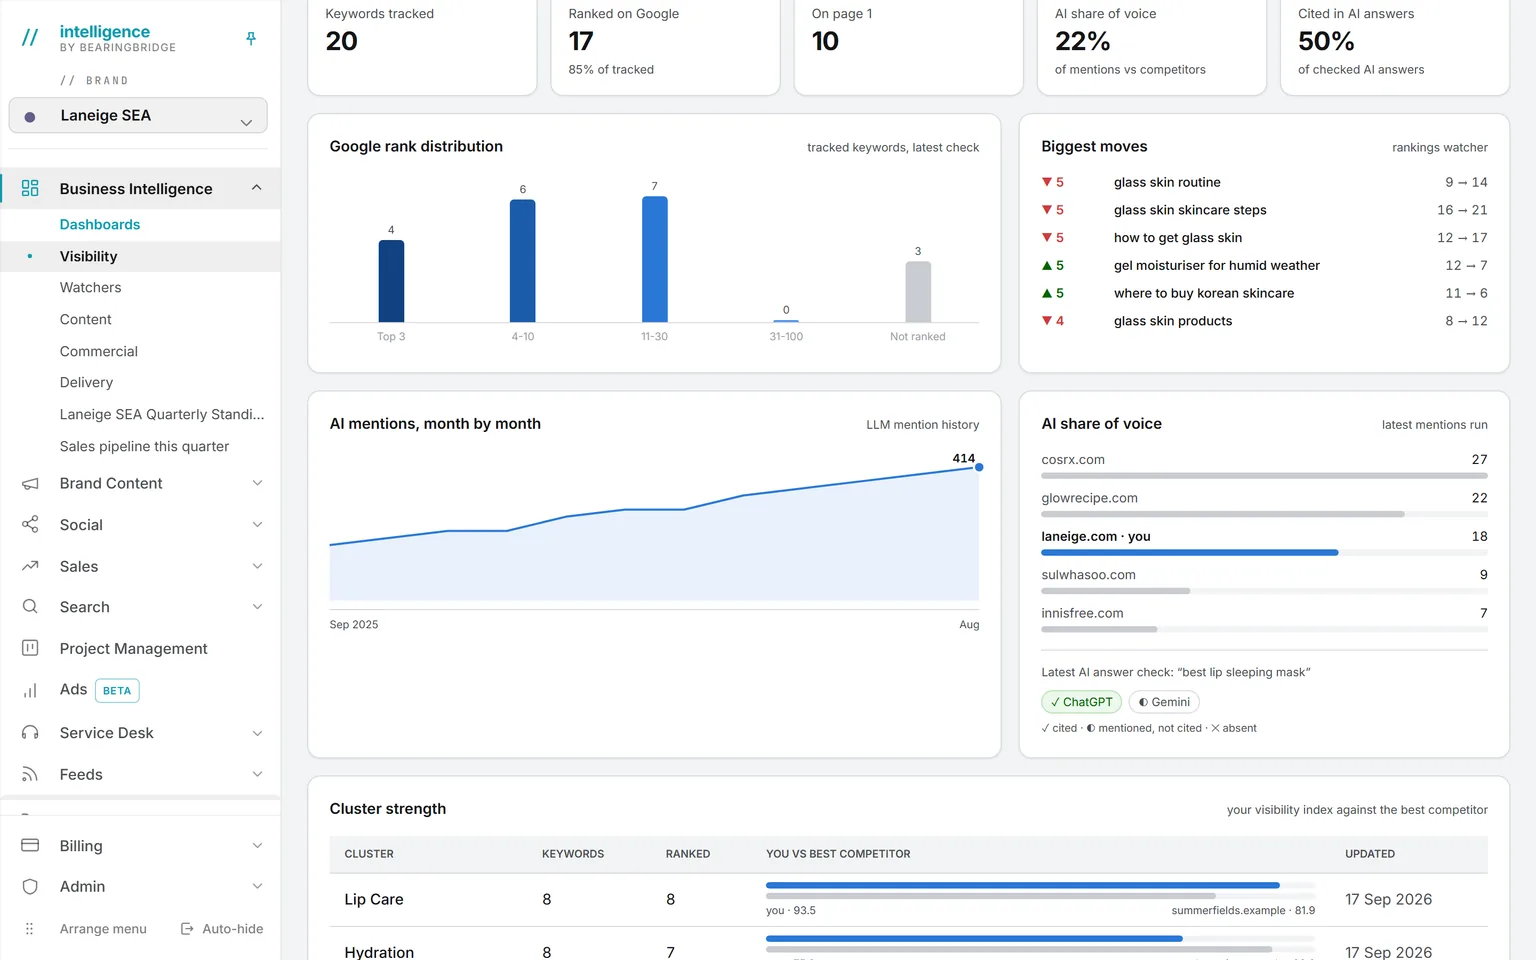
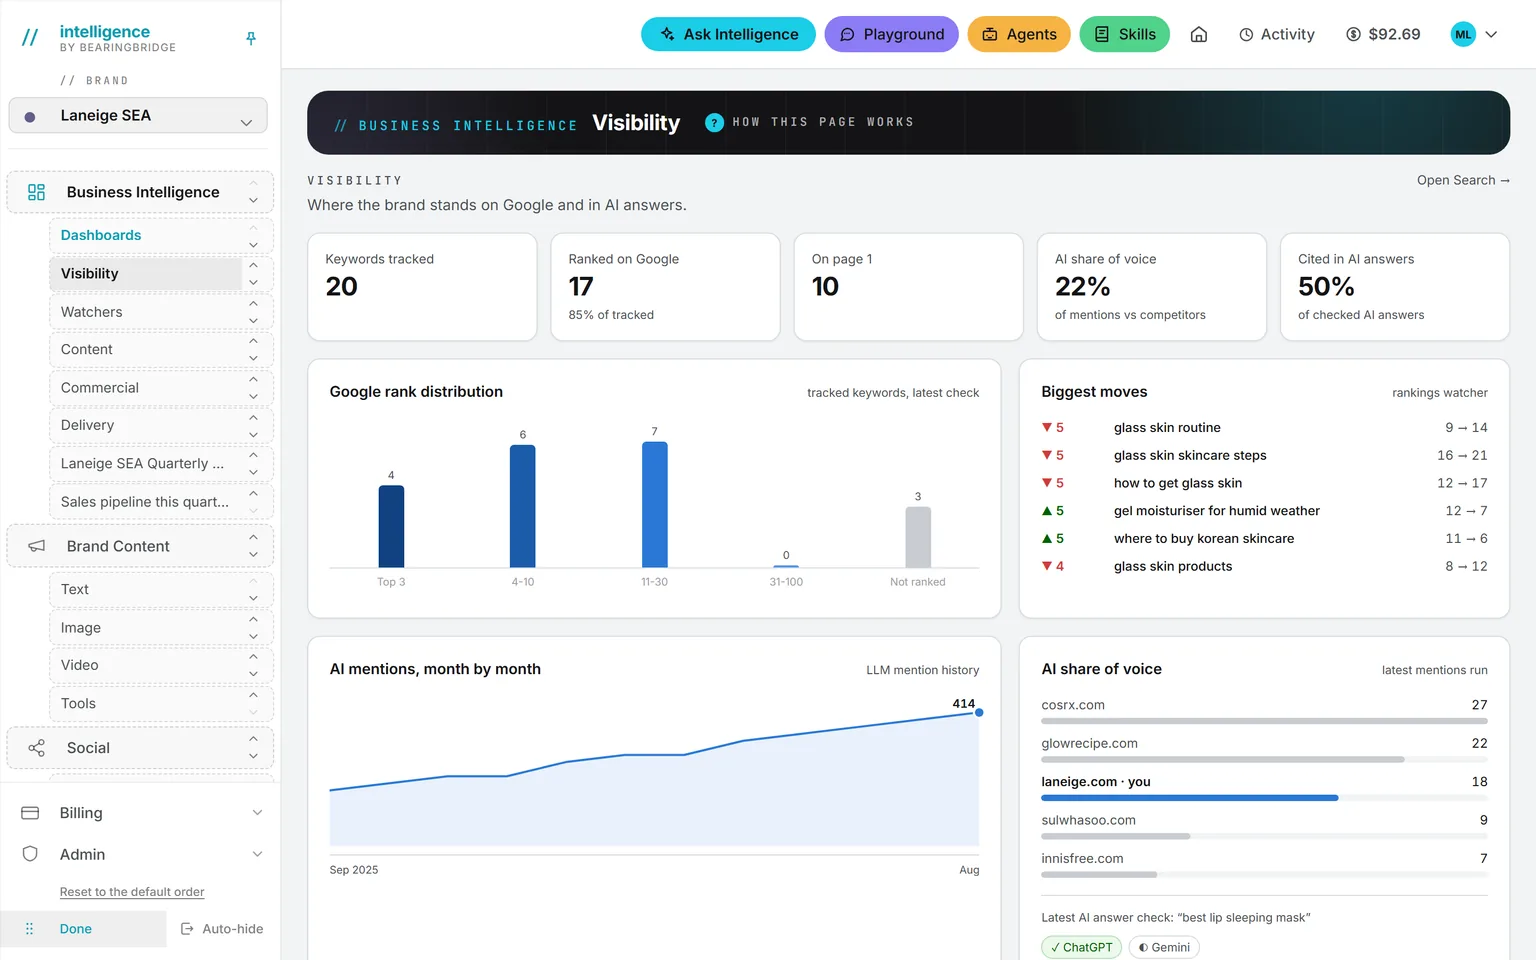
Visibility. Where the brand stands on Google and in AI answers, plus the moves that mattered this week.
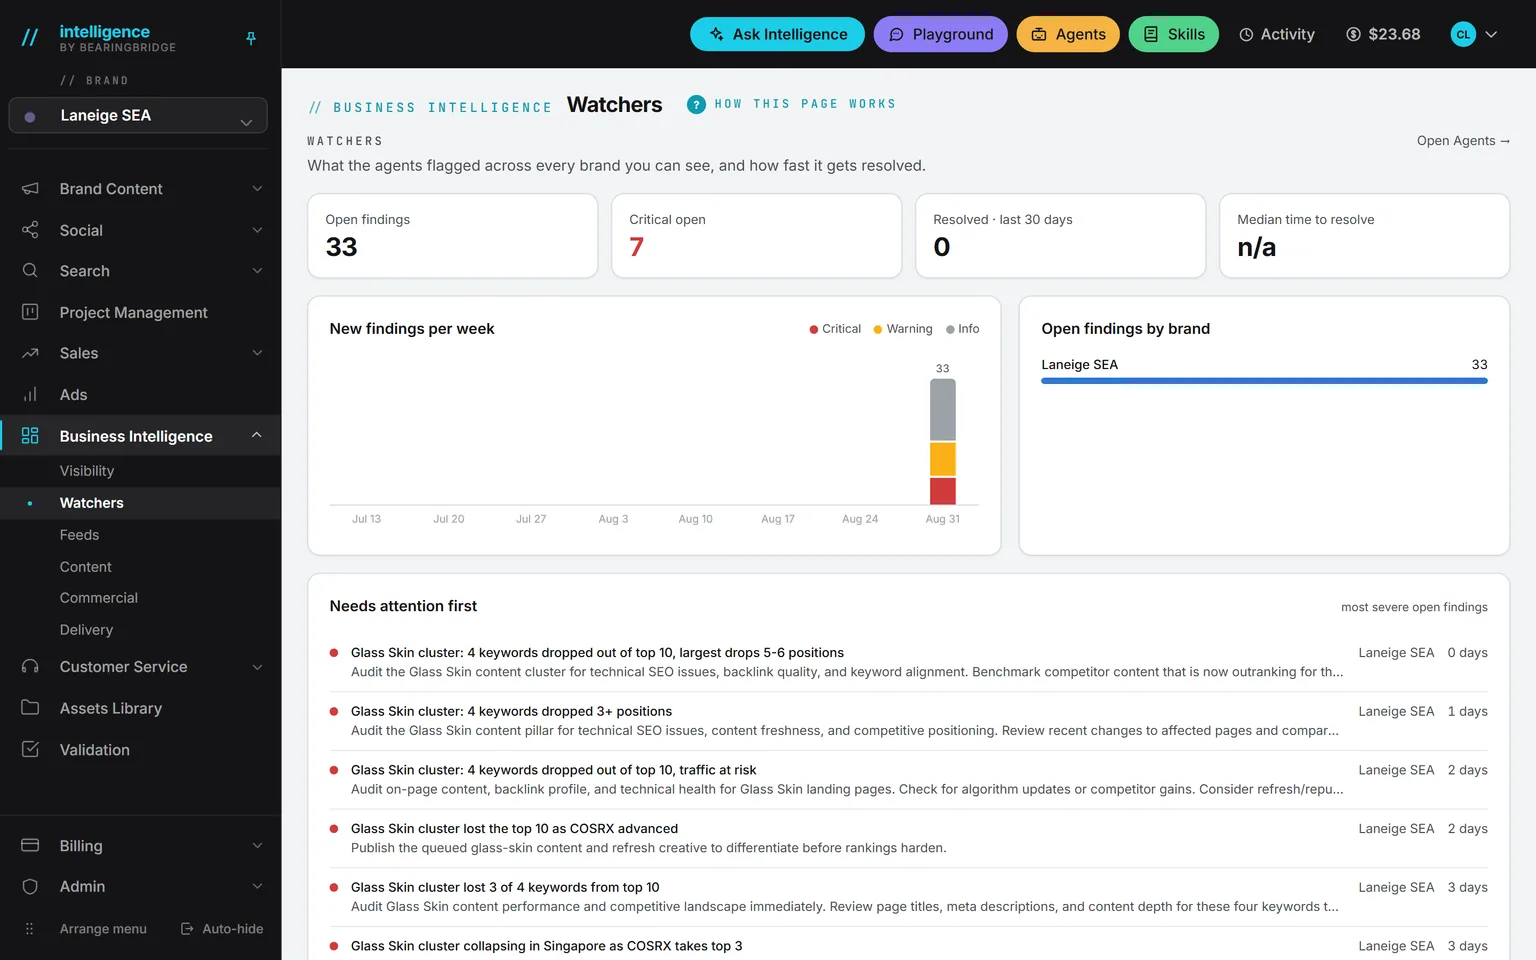
Watchers. What the agents flagged across every brand you can see, how severe it was, and how many days it took to close. It starts out of your menu: Put back on the Dashboards page brings it in.
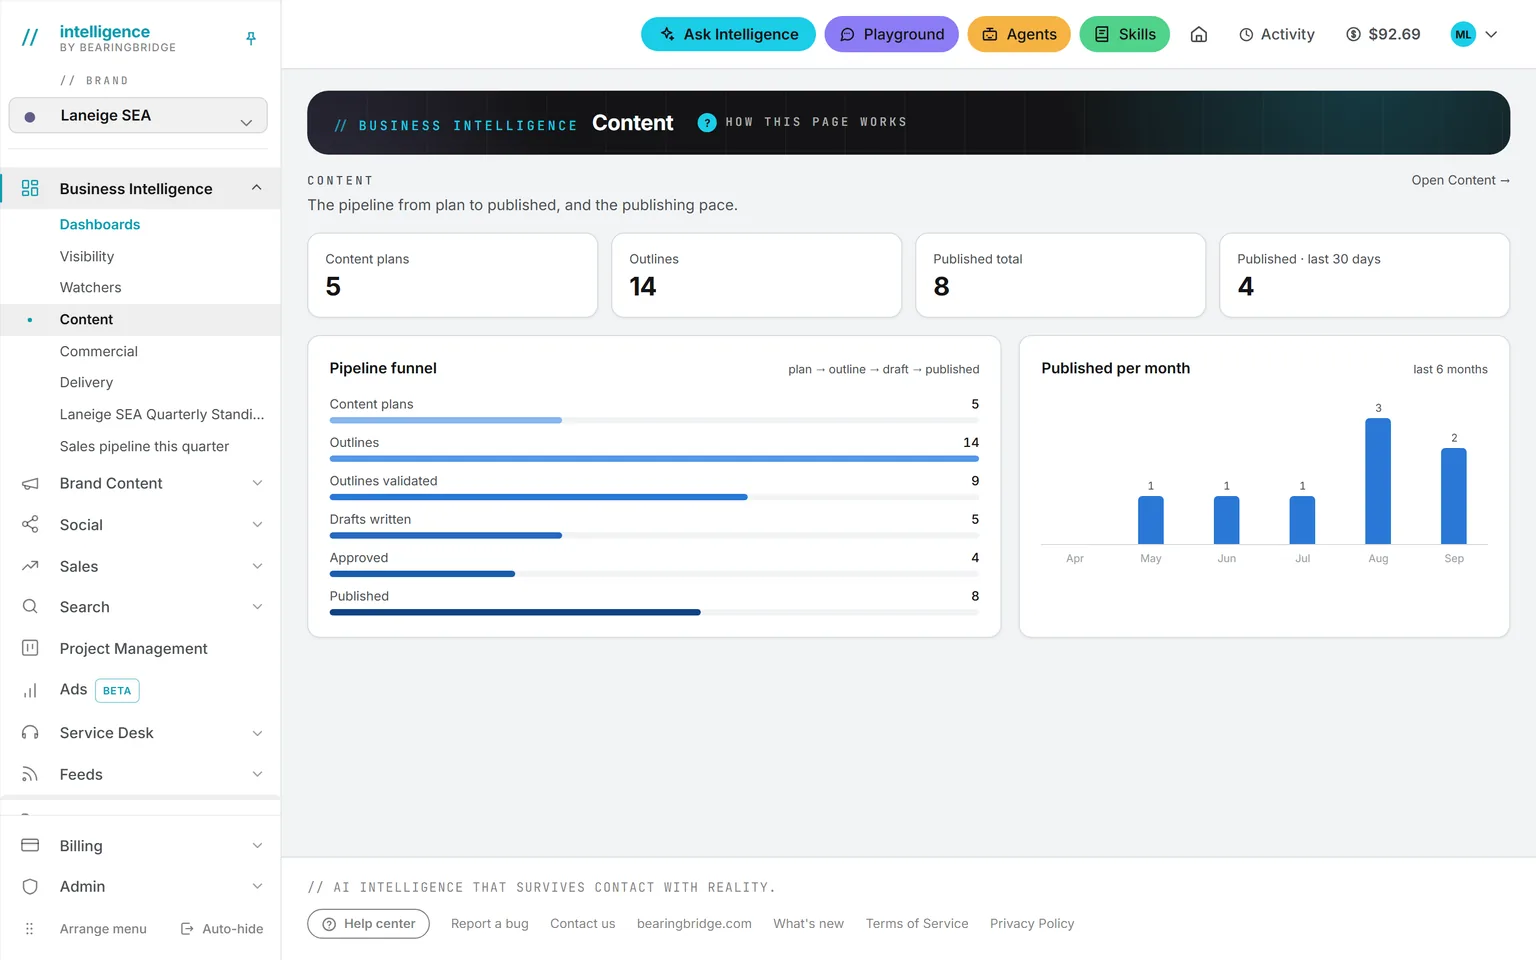
Content. Plan, outline, draft, published. The step where it stalls is the widest bar.
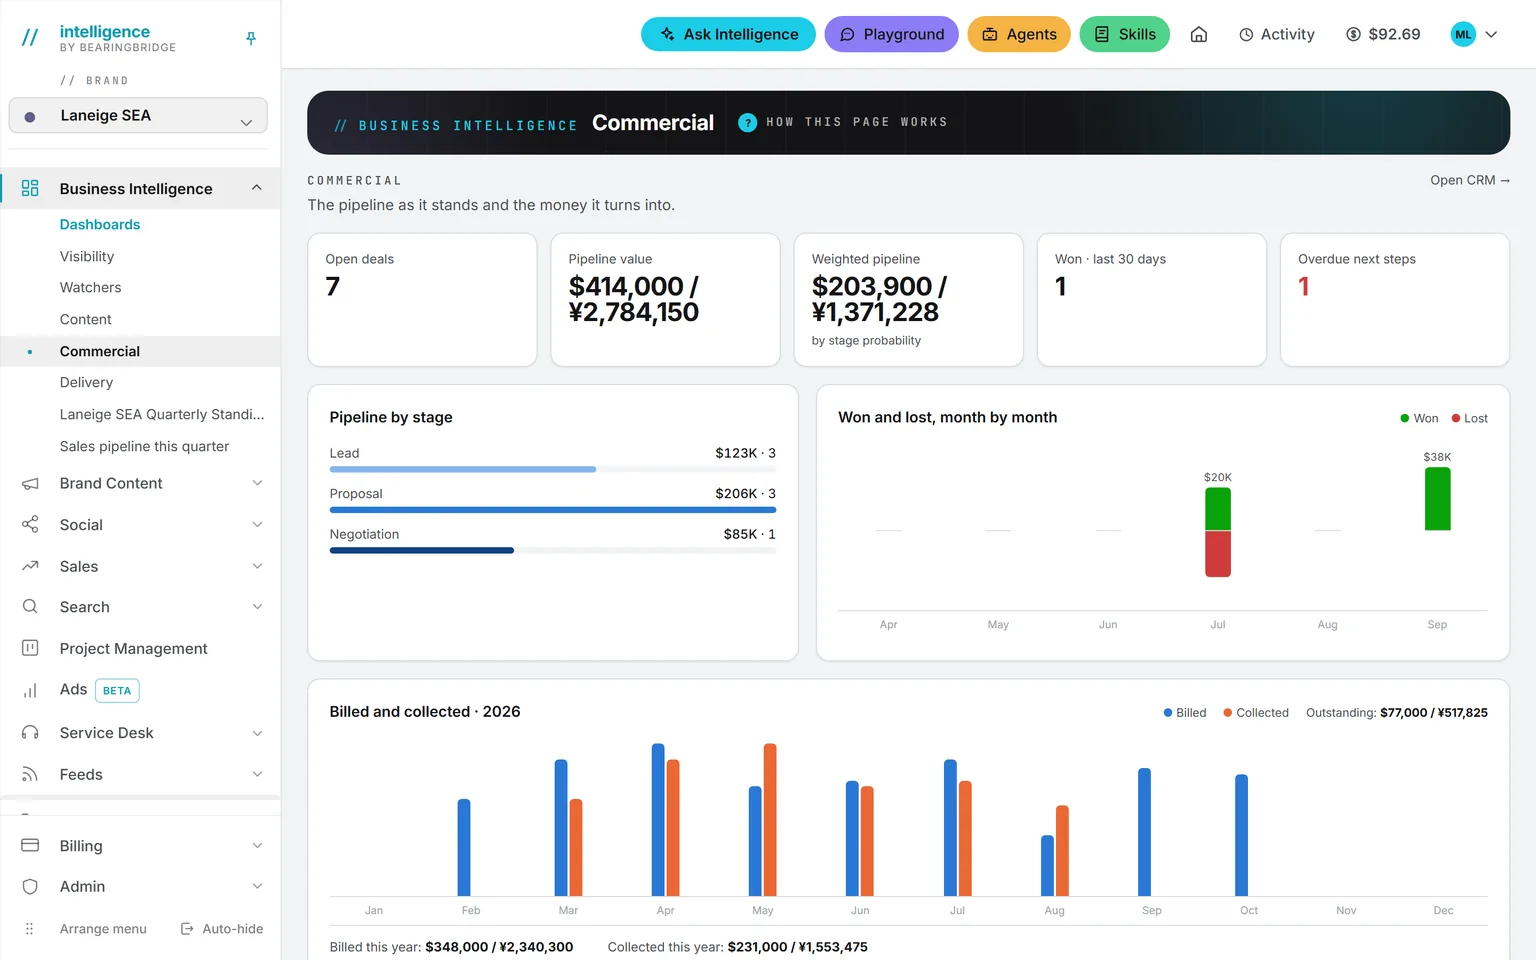
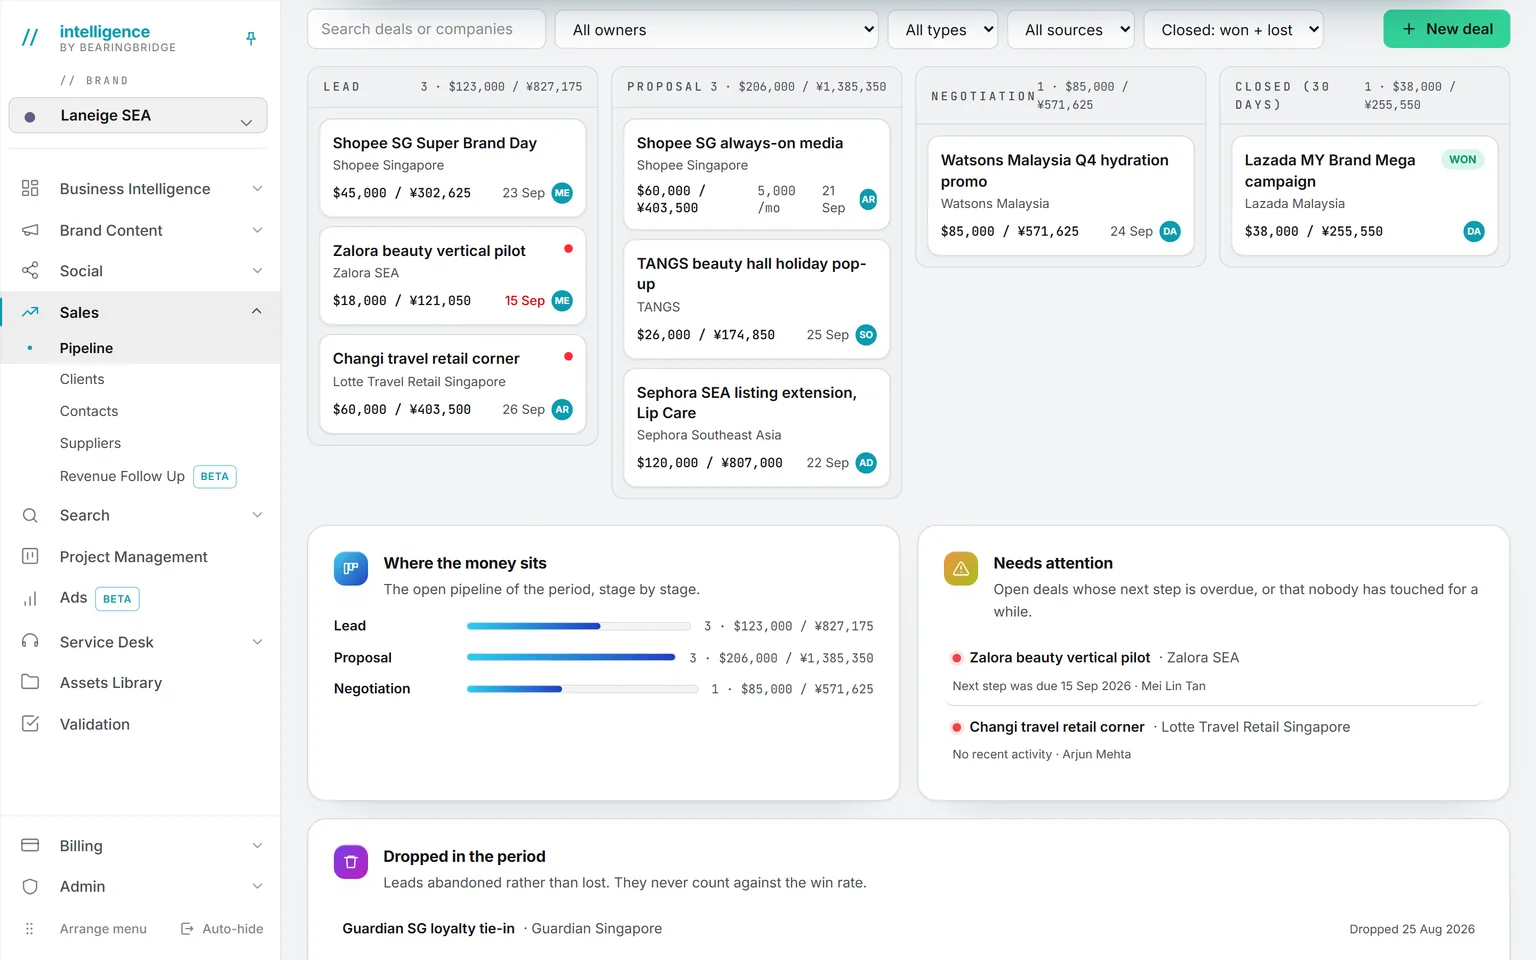
Commercial. The pipeline as numbers, the weighted forecast, and won and lost month by month.
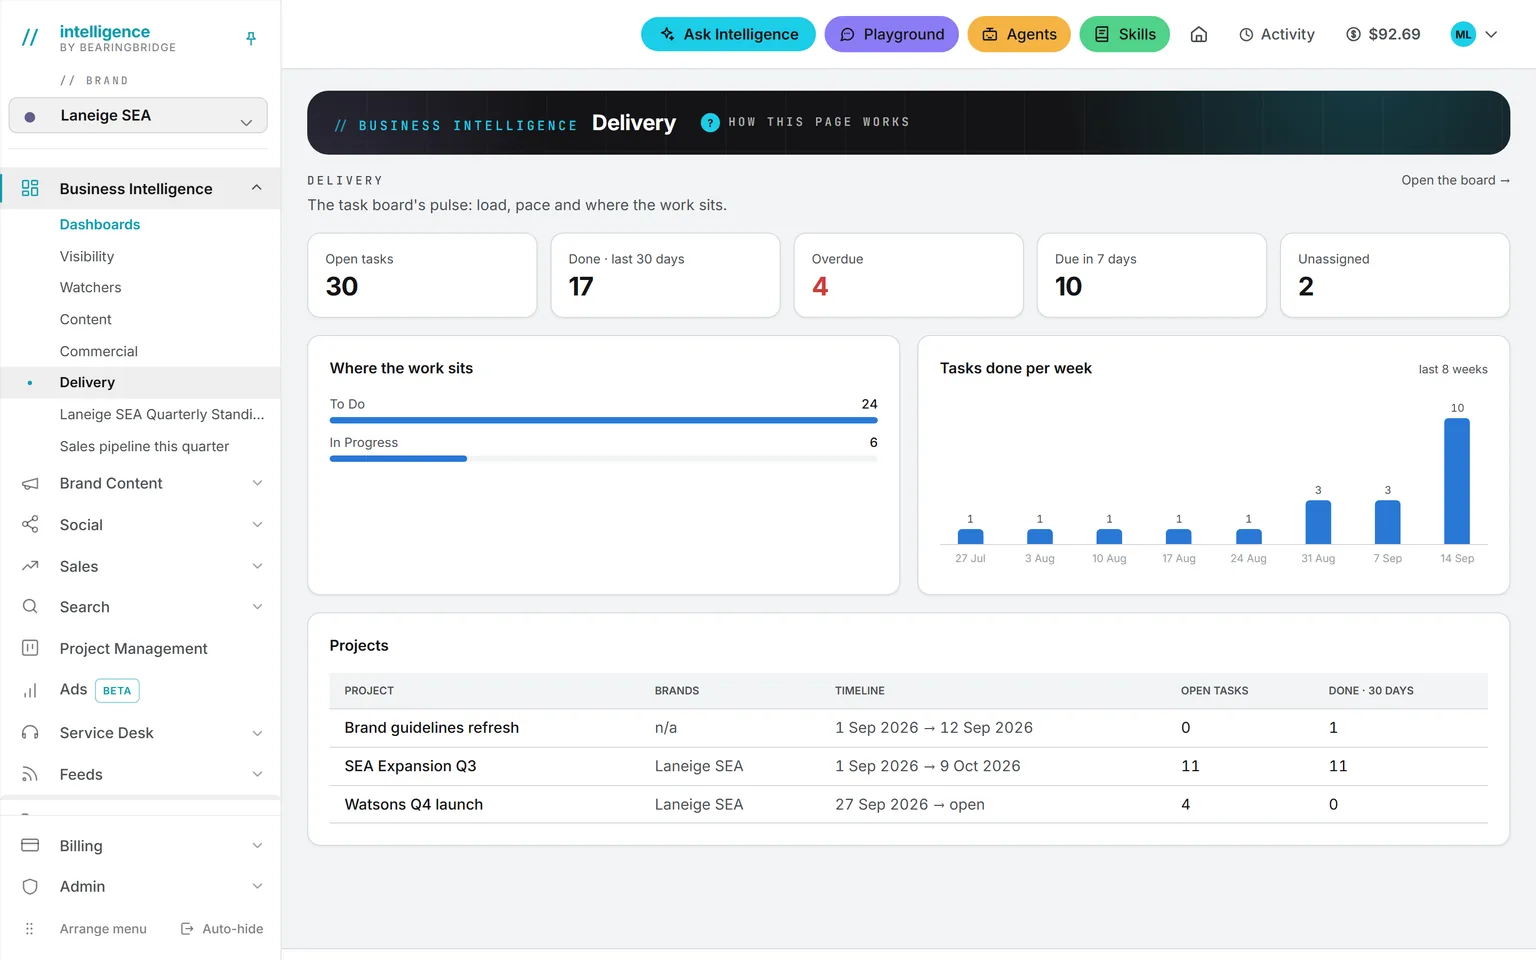
Delivery. Open work against finished work, counted only on the tasks you may see.
Every number is computed from the platform’s own tables when you open the page. Each one shows only what your capabilities and your role allow, cut into days, weeks and months in your own time zone, so the last 30 days means the same stretch in Singapore as in Paris. A dashboard whose module is switched off is not in the menu at all.
Visibility, Content, Commercial and Delivery sit in your menu from the start. Watchers, the fifth, waits on the Dashboards page until you put it back, and any standard dashboard can leave your menu the same way. Those answer the questions every team asks. The next one, the question that crosses two modules and belongs to your week, you write yourself.
Dashboards first, until you say otherwise.
The dashboards are not tabs on one page. Each one is an entry of the Business Intelligence group in the left rail, with its own address you can bookmark or send to a colleague.
Dashboards comes first, so the module opens on the list of everything you can look at. Press Arrange menu at the foot of the rail and drag the entries into the order that fits your day. Your order is saved on your profile. Whatever you put first is the page you land on when you sign in.
The dashboards you build join the same list, under the standard ones, and can be dragged anywhere in it. Reset to the default order puts everything back.
Since September 20, 2026: the module opens on Dashboards, and the news reader has moved out.
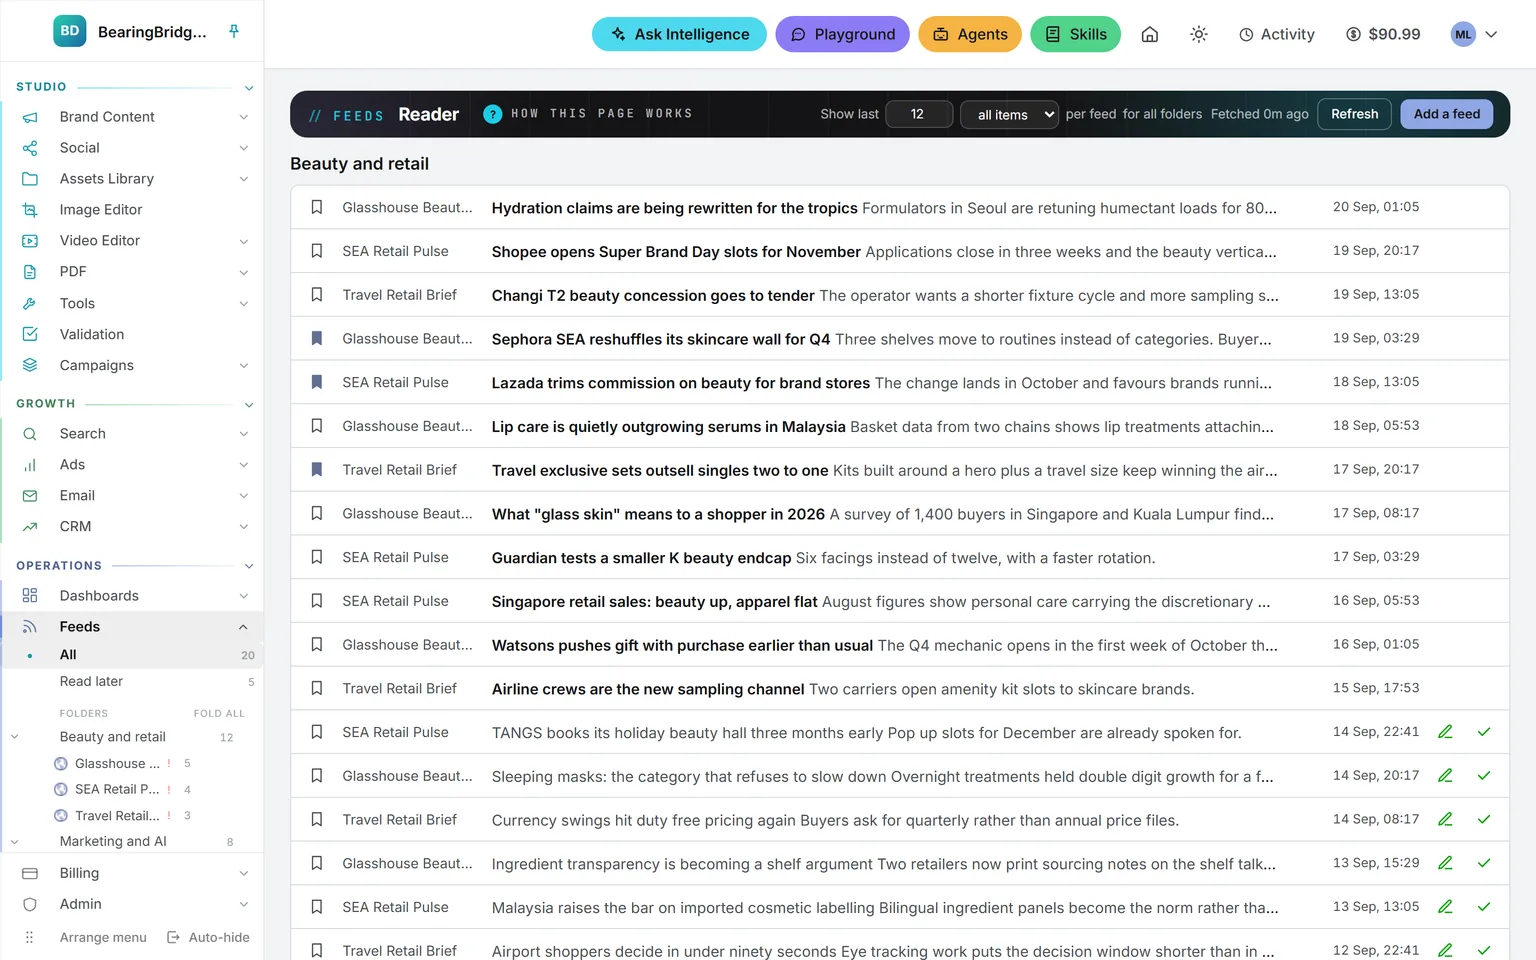
The news reader moved out
Feeds, the reader that used to open this module, is now a module of its own, open to every account. Its folders and its sources are the menu itself, on every page of the product, so a competitor’s blog is one click away from the numbers it explains.
The reading pane, the keyboard shortcuts, and the button that turns an article into a brief in any studio all moved with it.
You write one sentence. It comes back as a page.
The page nobody had time to build for you: the pipeline beside the overdue tasks, the keywords set against the articles that should be ranking for them. You write one sentence. Name the period, and what it should be measured against, and the page comes back sharper. Beside the box, a sketch lights up the blocks your words seem to call for: a hint, not a promise.
Describe
In your own words
Say what the page should show, and over which period. Pick none, one or several brands, and untick anything it should leave out.
Build
One run over your data
The model reads what you can read, works out the figures, and answers with tiles, charts and tables. The build is billed like a question, and the price sits on the page.
Keep
A page of its own
It lands in your menu with an address of its own, and opening it builds it again on today’s numbers, unless you built it minutes ago.
Change
One more sentence
Add a chart, move the period, drop a tile. The sentence is kept with the dashboard, so every build after it comes back in that shape.
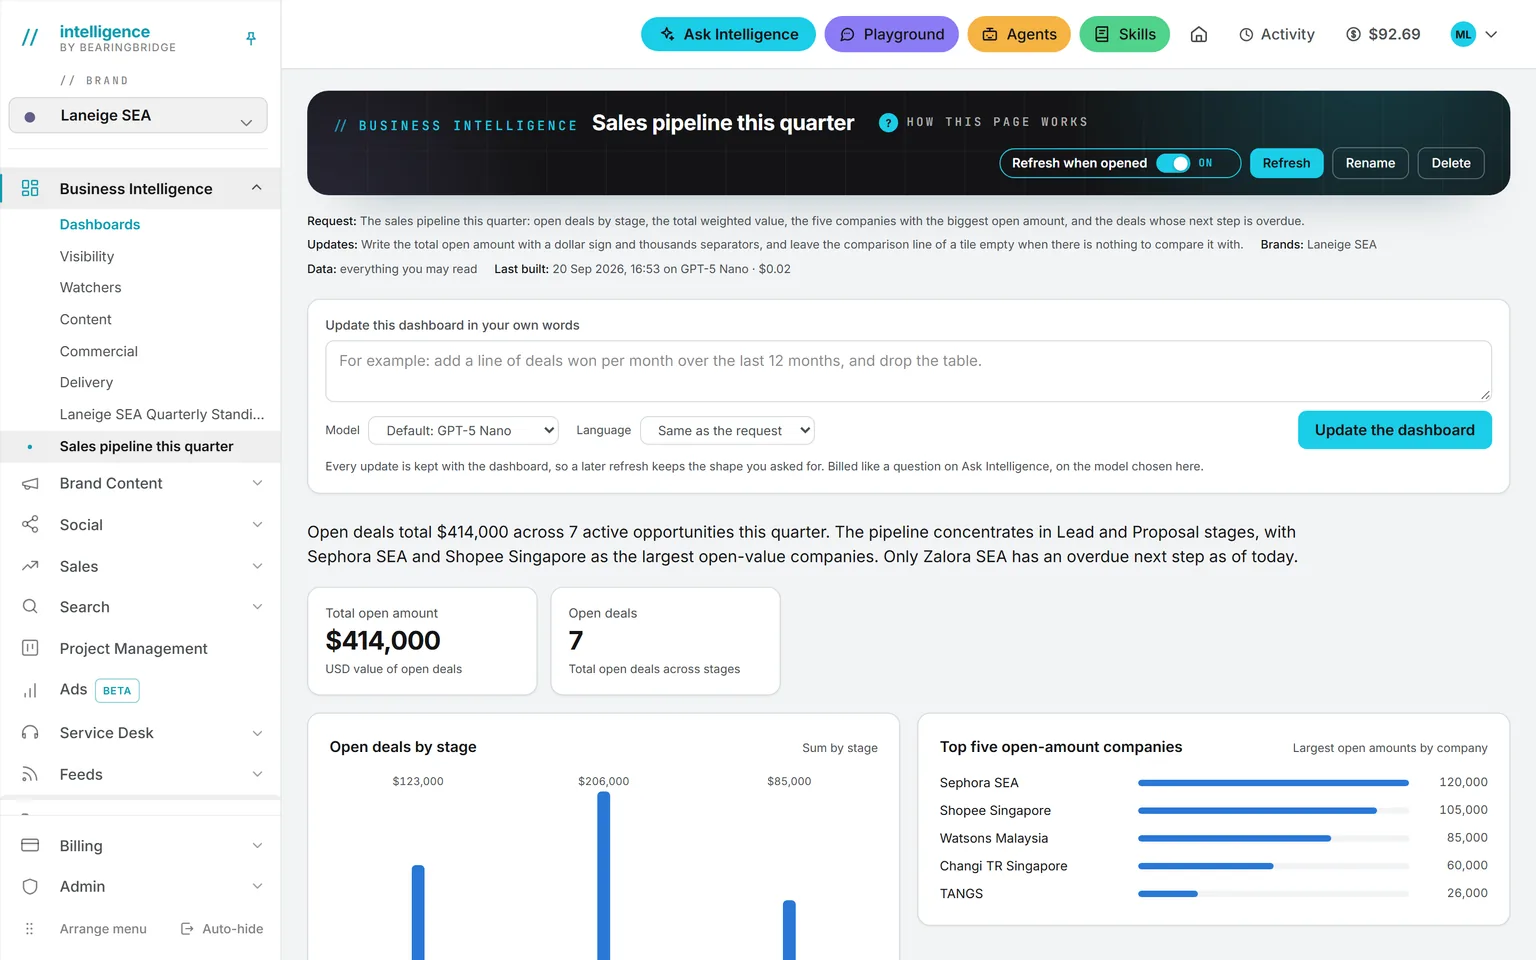
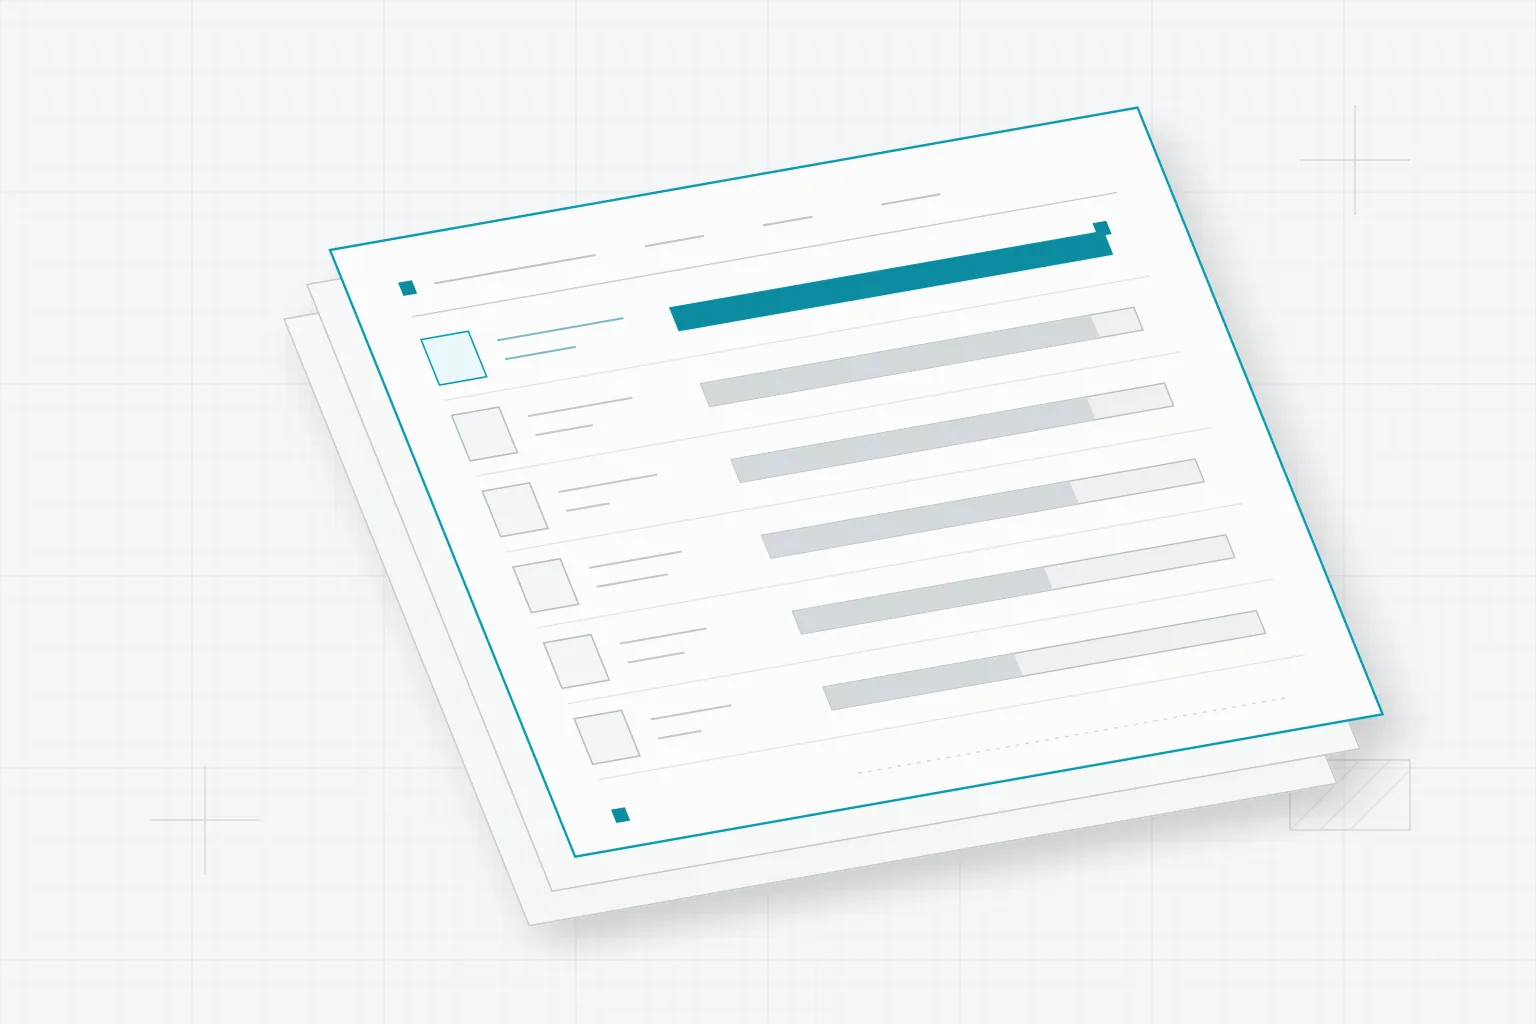
The dashboard. The request stays on the page, next to what the last build cost and the box that changes it.
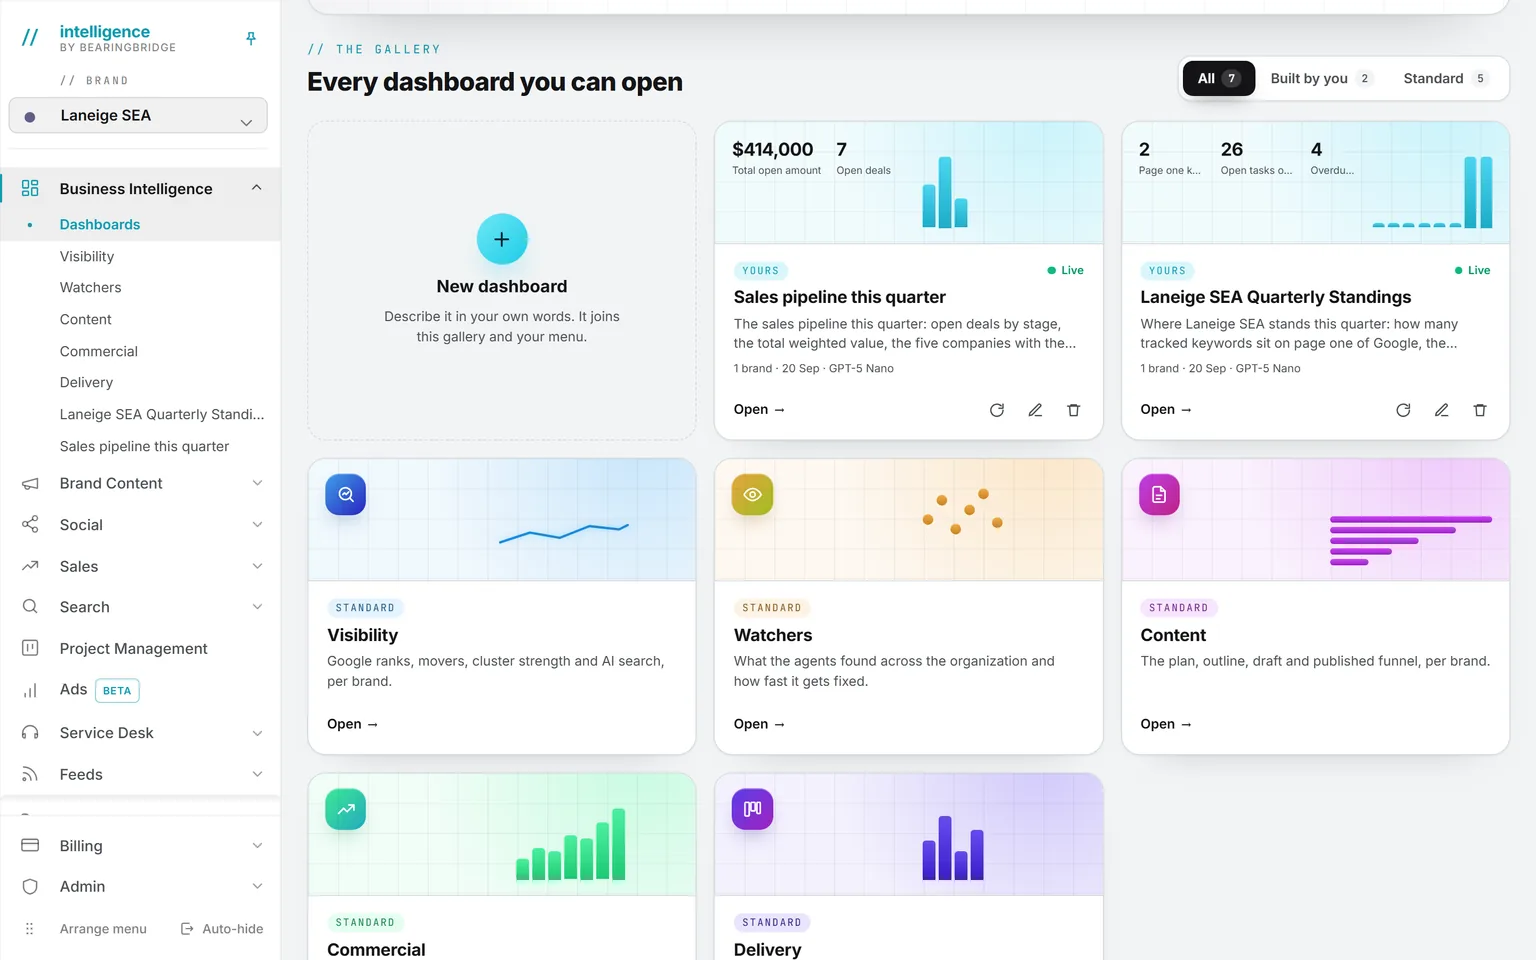
The gallery. Yours and the standard ones side by side, each card wearing the numbers it holds.
A build is an Ask Intelligence run told to answer in tiles and charts instead of paragraphs, so it obeys the same rules: the brands you may see, the modules your role opens, the systems your organization has connected. When the figures for a tile are not there, it leaves the tile out and says so in the notes at the foot, rather than drawing a number nobody can trace.
You can keep 40 of your own. Each one can be written in any of 32 languages, whatever language the data is in, and a role can be allowed to open dashboards without being allowed to build them. A build reads your data once and writes one layout, so it costs about what a long answer on Ask costs, at the rates on the pricing page, printed under the title every time.
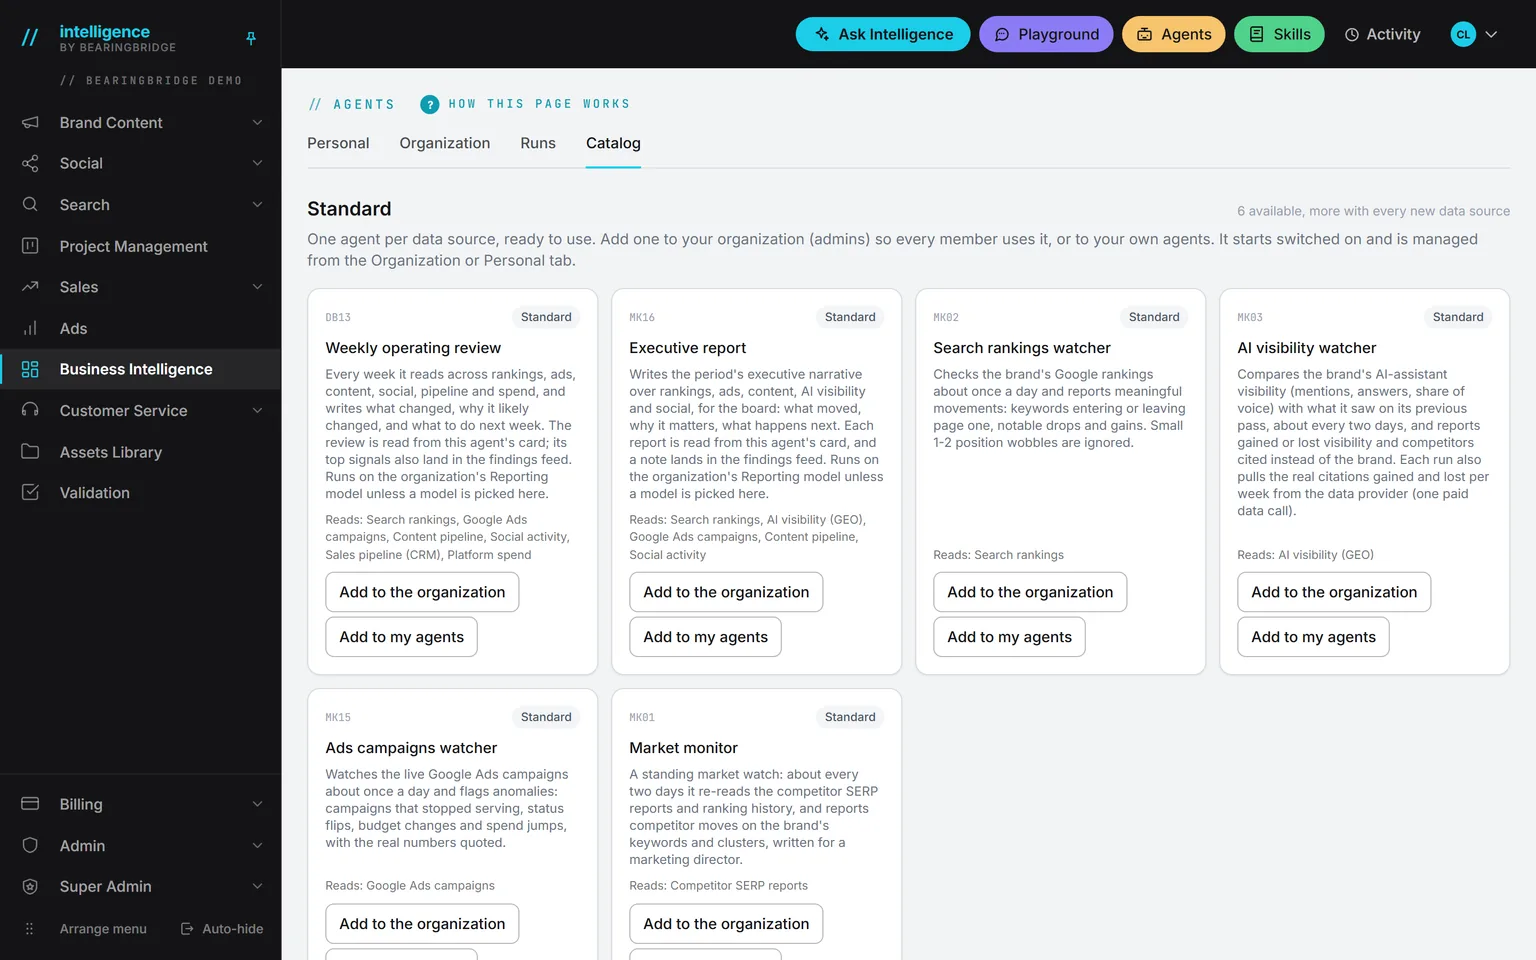
What moved, why it likely moved, what to do next.
Reads
Six sources, one pass
Rankings, ads spend, content, social, pipeline, and platform spend for the week, for one brand or several in the same run.
Computes
Causality, in code
The hints about what moved together are computed first, and handed to the model as labeled hypotheses.
Writes
Three sections
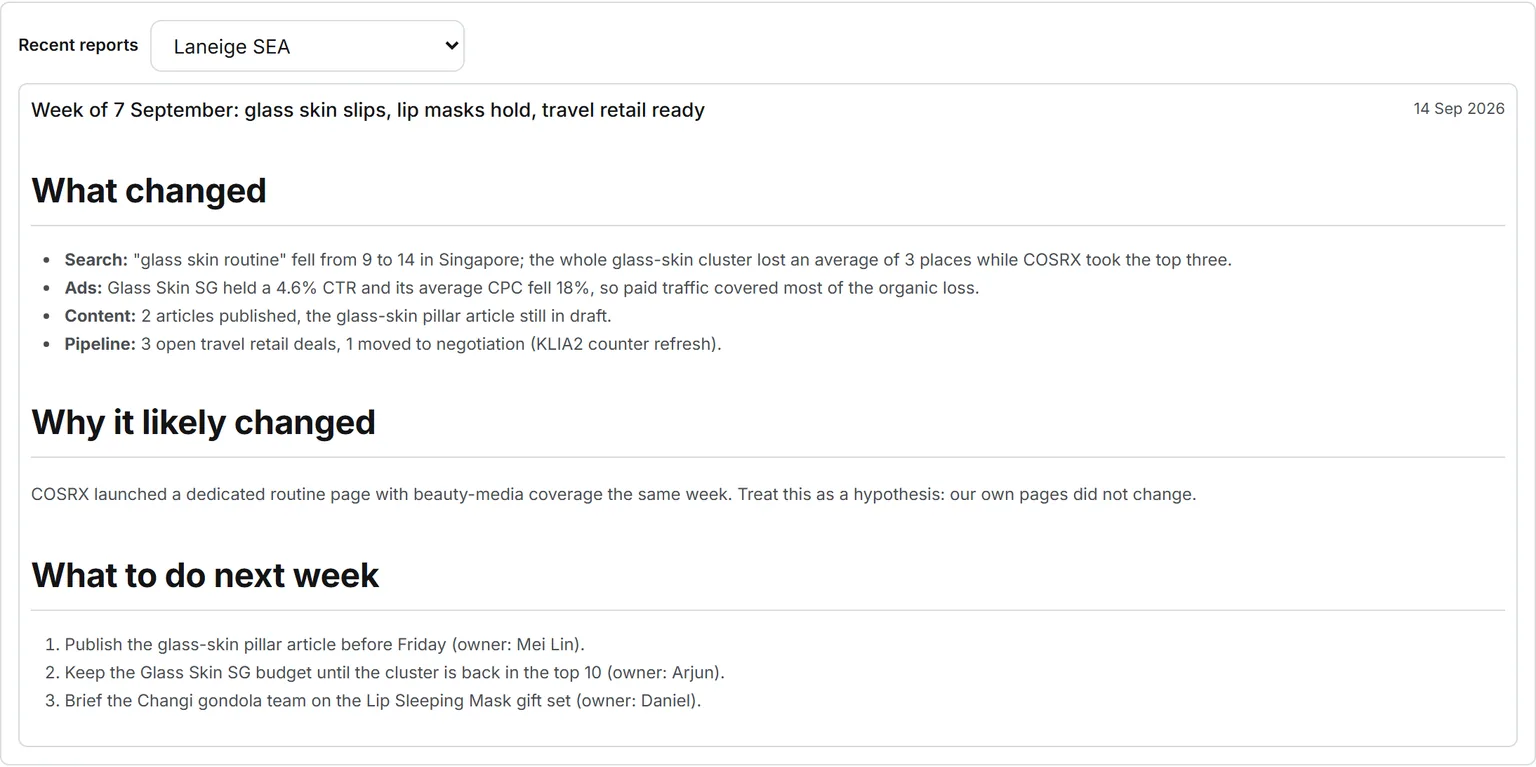
What changed. Why it likely changed, with confidence wording. What to do next week, three to five actions, in order.
Lands
A document, findings, a mail
The review is read from the agent’s card, its top signals become findings, and it can arrive by mail after a scheduled run.
A dashboard can tell you a keyword cluster fell three places. The review is the one that notices a competitor shipped a dedicated page the same week, and flags it as a lead worth checking.
The model does not invent correlations. The hints about what moved together are computed in code first, then handed over as hypotheses to write up with confidence wording. Without that step, a weekly review is a horoscope.
The executive report works the same way, once a month, for the board. Both are agents with a schedule, a budget and a model you choose. Either can read one brand or several in the same run.
When the chart does not answer, ask the rows.
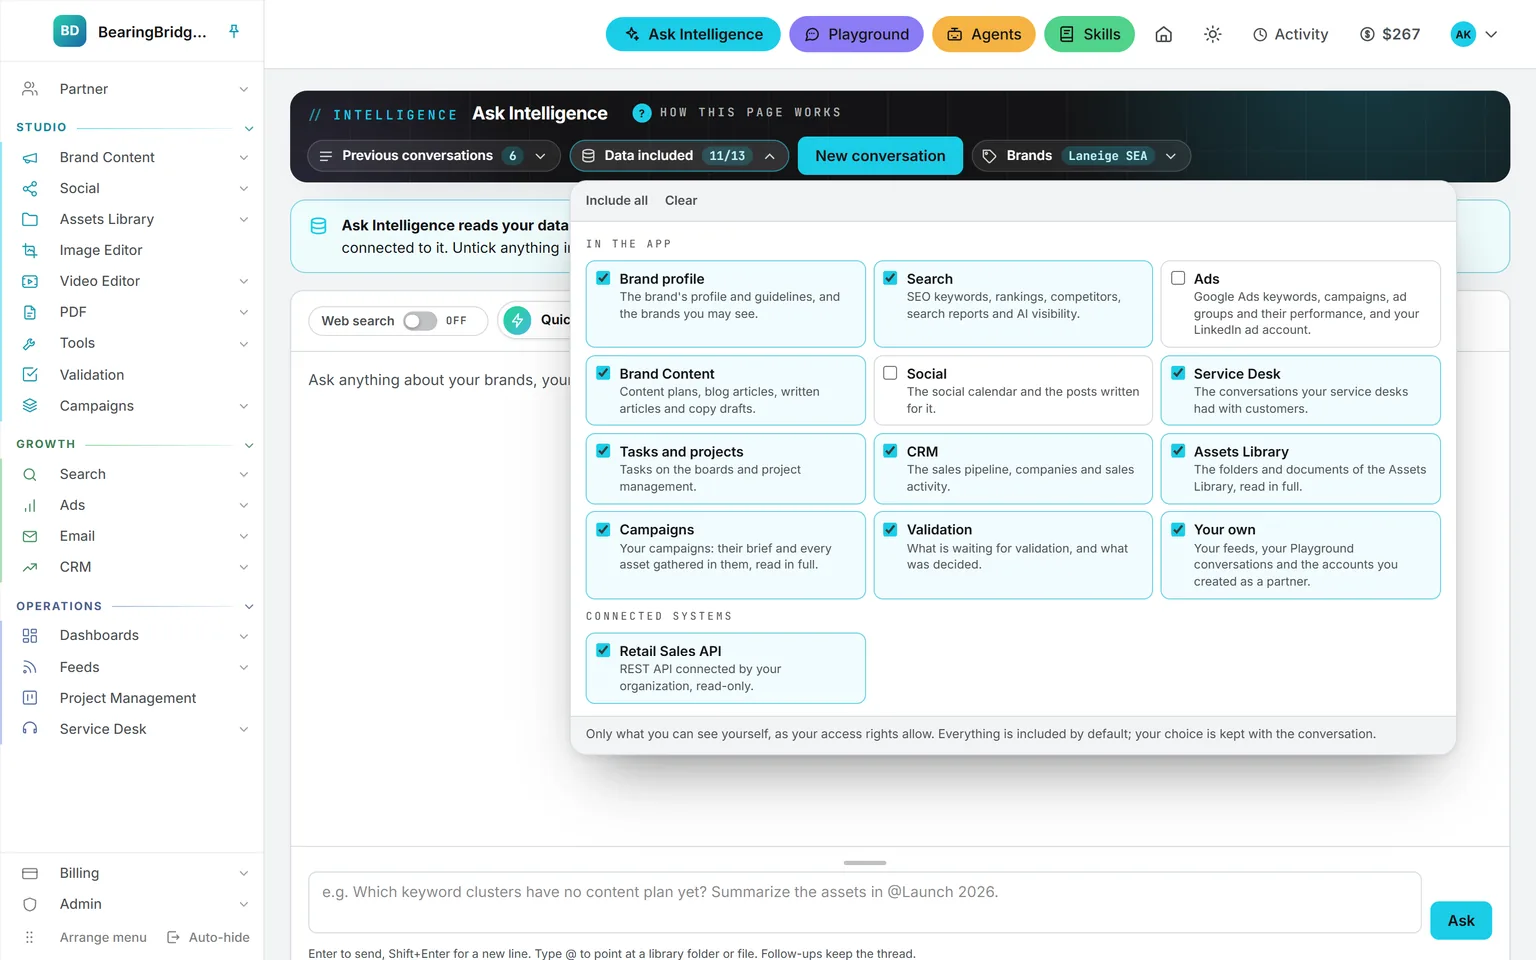
Ask Intelligence has its own page, one click from the header. It reads the rows behind Visibility, Content, Commercial, Delivery and the sources you follow, for none, one or several brands, and quotes the figure with where it came from and what the answer cost.
A connected system, such as a retail sales API, rides along too, and so does your own Gmail or Google Sheets. Each conversation is kept where you left it, and you can narrow what it reads before you ask.
> which glass skin keywords lost ground since the last check?
What it is, and what it is not.
It is not
- A warehouse you pipe every system into on day one.
- A canvas with 200 widgets and a drag handle. You write the sentence, and the model decides the layout.
- A dashboard that goes stale between refreshes.
- A shared workspace. What you build stays yours.
It is
- Five live views over what the platform already produces: rankings, findings, content, pipeline, and delivery, each in your own time zone.
- A builder that answers in tiles, charts and tables, over the data your account may read.
- A weekly review and a monthly report written from those rows, with the reasoning shown.
- A question box that quotes the figure and where it came from.
The same data, one door over.
Nothing here is an integration. These run on the same account, the same brand, the same ledger, so a finding on one page becomes work on the next.
Not built yet, said first
- A dashboard you build belongs to you. There is no shared gallery, no copy for the team, and no way to mail one.
- The standard dashboards chart the platform’s own tables. A system you connect answers in Ask and in the dashboards you build, not on the standard ones.
- No alert thresholds you set yourself. The review and the report can reach your inbox; a dashboard cannot.
- A dashboard you build shows its last build, not a live stream. It redraws when you open it, or when you press Refresh.
The catalog lists every agent as built, partial, or not built. Checked against the product on October 4, 2026.
Usage is paid from a prepaid wallet, with no seat fee. The rates are on the pricing page.
Nothing to build before the first number.
Switch on a module and its dashboard is in the menu. Write a sentence and the page you wanted sits beside it. The weekly review comes from the catalog, and with no run behind it yet, the first one lands the next morning.
No subscription. No seat fee. No card needed to open an account.