The usual version of this conversation is about channels. Non-branded search costs more and converts worse, so the line moves to LinkedIn, somebody draws the chart, and the meeting ends on time.
The chart is correct. What it cannot do is explain why the returns fell, which is the only thing that would tell you what to do next.
What follows is the other version. Three levers, what broke in each, what AI changes about it, and what it leaves exactly where it was.
Three levers, and why each stopped paying
The first lever was buying attention at the moment somebody wanted something. Non-branded search targeted the problem rather than your name, and the click was the transaction. That mechanism is coming apart from both ends. Answers now arrive on the results page and inside assistants, so the question gets settled without the visit.
LinkedIn now takes 41% of B2B ad budgets, up from 39%, while non-branded search fell from 37% to 33%. Cost per click on non-branded terms rose 29% and click-through rate fell 26% in a year.
— Dreamdata, LinkedIn Ads Benchmarks Report 2026, March 10, 2026 · aggregated from more than 66 million sessions and 3.5 million customer journeys
Dreamdata’s press release calls the 41% a share of paid social budgets while the report blog calls it a share of ad budgets, so read the two-point move as direction rather than measurement. The direction is not in question.
The second lever was reading the result inside a quarter. That one broke quietly, because the journey got longer while the reporting cycle did not.
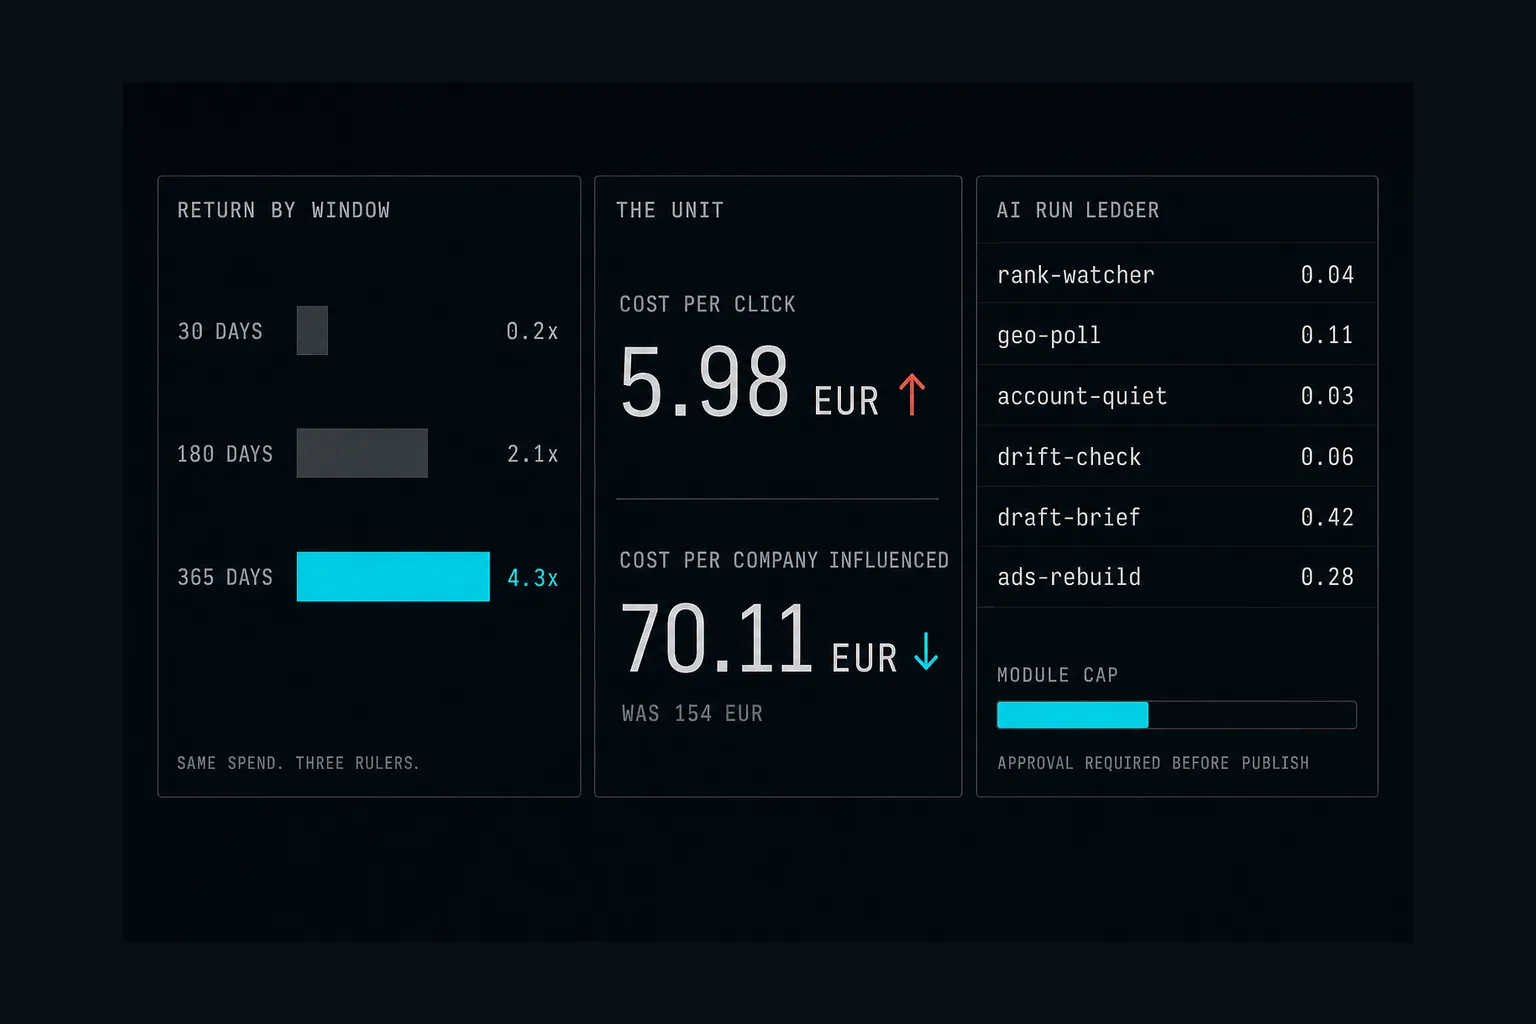
Median return on LinkedIn ad spend runs 0.1 to 0.3x at 30 days, 1.5 to 3.0x at 180 days, and 3.0 to 6.0x at 365 days.
— GrowthSpree 2026 benchmark data, April 29, 2026 · medians across tracked B2B accounts, reaching us through secondary reporting rather than the primary release
Treat that as a shape rather than a constant, since your own curve moves with deal size. The shape, cheap-looking early and expensive-looking late, holds. Judge a 272-day journey on a 30-day report and it will always read as a failure, because on day 30 it is one.
The third lever was counting the people who responded. B2B does not sell to a person who clicked. It sells to a committee of ten, arguing across four channels for nine months.
LinkedIn cost per click averaged €5.98, against €5.19 on Google Search and €1.60 on Meta. Cost per company influenced ran €70.11 on LinkedIn, down from €154 the year before.
— Dreamdata, LinkedIn Ads Benchmarks Report 2026, March 10, 2026 · averages across all tracked B2B advertisers, not a single-account figure
On cost per click the case against LinkedIn writes itself. On cost per company influenced the same channel roughly halved its price in a year. Both numbers come out of the same dataset, which is the uncomfortable part.
Where each one failed, and where you can see it
| Lever | What broke | Where it shows in your numbers |
|---|---|---|
| Attention at intent | The answer arrives without the click | Sessions fall while demand does not |
| Reading it in a quarter | The journey outran the reporting cycle | A 30-day return of 0.1 to 0.3x |
| Counting the responders | The responder is ten people, not one | Click price rises as company price falls |
Figures behind the third column are cited in full above. Reviewed August 2026.
None of those is fixed by moving budget. They are fixed, or not, by what your company is able to do between the reviews.
Being present where the answer forms
If the answer now arrives without the click, the work moves to being present inside the answer. That means knowing what the assistants say when somebody asks your buyer’s question, which is not something a rankings report tells you.
The reason this matters is not traffic. It is that the shortlist closes months before anyone calls you, and it closes without you in the room.
94% of buying groups ranked their preferred vendors before first contact with a seller, and bought from that preliminary favorite 77% of the time.
— 6sense, 2025 Buyer Experience Report, November 12, 2025 · more than 4,000 buyers across North America, EMEA, and APAC
So the ranking is being formed while you are still waiting for the inquiry, and whoever sits at the top of it wins about three times in four.
This is the part AI does well, because the work is a polling job that never finishes. Somebody, or something, has to ask the same questions every week and write down what came back.
Rank tracking handles the search half and ties each position to the page that earned it. Generative engine optimization, GEO, handles the other half by asking the assistants directly and recording which ones name you, which cite you, and which do neither.
Then the content engine takes the gap and writes into it, eight stages from a keyword to a published article, with the draft waiting for a person to sign.
The return here is not cheaper clicks. It is presence in the place the click went, bought with content instead of media, and measured by whether the assistants name you rather than by traffic.
On timing, be realistic. The baseline takes a week. Movement in what the assistants say takes two to three quarters, because it depends on sources you do not own. Anyone promising faster is describing the baseline and calling it the result.
Making a nine-month window survivable
Here AI changes nothing, directly.
You set the window. No machine is going to decide on your behalf that 30 days was the wrong ruler.
What AI changes is whether a long window is survivable. Nine months is a long time to hold a picture, and the failure is rarely a bad decision. Usually nobody looked in week six.
Which is where the machinery earns its place, so here is what the machinery is.
A watcher is a standing job with a schedule, a budget, and a defined slice of data it may read. It runs whether or not anyone remembers to ask.
Watchers report what moved. Drafters produce the response. Nothing publishes or spends until somebody with the role signs it. The weekly operating review arrives with what changed and why, and findings become cards on a board with an owner and a date instead of dying inside a report.
Ask Intelligence answers a question from your own data with the real figure and its source, or says the data is not there.
That refusal is the feature, and it is worth being specific about why. A measurement problem that took nine months to surface will not be fixed by a system that fills in a number when it cannot find one. It will be buried by it, for another nine months.
The return is a shorter distance between a thing going wrong and somebody knowing about it. On a 272-day cycle, that distance is where most of the loss lives, and it is the one number in this piece you can move in a week rather than a quarter.
Counting companies instead of clicks
Counting companies rather than clicks is a data problem before it is an insight. Ten people, four channels, nine months, and the evidence scattered across systems that were never reconciled.
That reconciliation is the boring half of every AI program that works. We spend more of the first two weeks on it than most clients expect to, and it is the part that decides whether anything after it is trustworthy.
Connect the systems, define the metric once, make the sources agree, and only then ask the question. Ask Intelligence reads through read-only tools scoped to the brand, so the figure it returns is the figure in your system.
On top of it, the pipeline flags deals that went quiet before anyone notices, and projects revenue forward off the deal record rather than off a feeling.
LinkedIn returned 121% on ad spend, against 67% for Google Search and 51% for Meta. Among top-performing accounts the same three figures read 279%, 138% and 133%.
— Dreamdata, LinkedIn Ads Benchmarks Report 2026, March 10, 2026 · data-driven attribution on closed-won deals over twelve months, impressions excluded
Look at that second row for a moment. The distance between the average account and the top quartile is wider than the distance between the platforms.
That gap is not a media buying secret. It is execution held steady over months, and that kind of work has never scaled with headcount. It does scale with something that runs on a schedule and does not get pulled onto a launch.
Where AI does not help
Say this part plainly, because the market mostly does not.
AI does not shorten the 272 days. Ten people do not agree faster because a machine is watching them. Anyone selling a shorter buying cycle is selling something that is not on the market.
Your measurement window, your unit, and your kill criterion stay management decisions. Hand those to a system and you end up with a very well instrumented version of the wrong question.
Data nobody reconciled stays broken. Pointed at three systems that disagree, it will answer confidently from whichever one it read, or, if it is built properly, refuse to answer at all.
And it does not make the case for itself. Volume was never the constraint, so an AI that produces forty more campaigns is answering a question nobody asked. A team of four already generates more than it can honestly judge.
What it costs to run
Here is the objection, and a good CFO raises it about ninety seconds in. You have just argued that unmeasured spend is dangerous. Adding an unmeasured AI line underneath it would be a strange conclusion to reach.
So the AI goes on the same ledger as the spend it is judging. Every run recorded with who ran it, what it did, when, and exactly what it cost. A hard cap per module. An approval gate in front of anything that publishes or spends. The price shown before the run rather than discovered at the end of the month.
Seats are free, which matters more than it sounds. Nobody pays to have an account, so the watching does not get rationed to the three people who were issued a license. What you pay for is what the AI actually runs, out of a balance that does not expire.
A watcher checking rankings every morning for nine months shows up as a running cost, itemized, next to what it produced.
We do not publish rates on this page, because the price of a run depends on the work and you see it before it runs rather than after. What we will say about the shape: the watching costs an order of magnitude less than the producing, which is the opposite of how most teams budget for AI.
Then the arithmetic is available to anyone who wants it, and the return stops being a matter of belief.
Five decisions, in this order
If you have an hour this week, the first one pays for the other four.
Start where the answer is
Poll the assistants before you buy another click
Run your buyers’ actual questions against the assistants they use and record three outcomes: named, cited, neither. That baseline costs a fraction of a month of non-branded media. Run it yourself, or take the fixed-price audit, but take it before the next budget decision rather than after.
Put the watching on a schedule
Standing jobs, not somebody’s Thursday. Rankings, accounts that have gone quiet, message drift by market if you sell in more than one. The point is not insight, it is that the gap between a slip and somebody knowing stops being six weeks.
Fix the data before the question
Reconcile the systems, then ask. An answer with a source you can check beats a faster answer. Connect what you already run, define each metric once, and hold the system to quoting the real figure or saying the data is not there.
Reset the window and the unit
Report 30, 180 and 365 on the same slide, every time. Make the account the row rather than the click. Neither of these is an AI decision, and both of them decide whether the AI work reads as a return or as a cost.
Write the stop before the first invoice
The kill criterion, in writing
Ours reads about like this: if 180 days of watching has not changed a budget decision or surfaced a slip somebody acted on, we stop, we put the reason in writing, and the money goes somewhere with evidence behind it. That is the Bearing phase of our AZIMUTH method doing unglamorous work, and it is the step most AI programs skip on the way to the interesting part.
Related reading: Your buyers decide before the click, if you want the full argument behind the 6sense figure above, and Connecting AI got cheap. Deciding did not, if the question you are really stuck on is build or buy.
Benchmark data revises, vendors restate, and platforms change what they report without announcing it. We check this piece on the first of the month and mark what changed. Corrections to hello@bearingbridge.com.